Note to readers: The full project can be found at this link here.
The basics of data visualization involve making concepts or findings easier to understand through imagery. Baseball is one of many notable sports that use statistics to make decisions and evaluate player performance. Sabermetrics have been used most often in Major League Baseball to determine a hitter’s batting average or a pitcher’s wins above replacement (WAR).
You get to know how players perform on offense as well as how well starting pitchers are evaluated based on more than their wins and losses in a regular season.
Historian, statistician, and author Bill James coined the term Sabermetrics for advanced baseball statistics and analysis of players. The Society for American Baseball Research (SABR) gave way to these performance metrics for James to provide insights to MLB players and how they contribute to their team(s) chances of winning games. These metrics, widely considered advanced as of the 1990s and 2000s eras of baseball, proved effective to teams’ successes, documented most notably with the Oakland A’s from 1997 to 2003 as perennial playoff contenders, dubbed “Moneyball”, because of the A’s payroll being consistently in the bottom five of all MLB teams, a trend that continues to this day. (As of the 2023 season, the A’s are the the team with the lowest payroll in baseball, with efforts to trade or let rising players walk in hopes of not paying them long term and/or lucrative contracts.
The success, however, has translated to teams like the Boston Red Sox, which won four World Series championships in 2004, 2007, 2013, and 2018, which consisted of owner John W. Henry willing to spend on taking advantage of the Sabermetrics trend. He hired James as an advisor and is widely credited with the successes of using advanced calculations and trends for players, be it hitting or pitching, to figure out how impacting they are on the team and what their priority level(s) are when it comes to winning games.
For this analysis, we will look at some basic calculations for how coaches and teams take advantage of these metrics to determine improvements to be made and the other factors that can make that player or team successful. Some of the basics of this project was to get familiar with cleaning and formatting data and visualizing information using Python’s matplotlib package to present what kinds of changes have been made over time with a player’s or team’s performance.
One example can be seen with the image below, which shows the slugging percentage of San Francisco Giants shortstop Brandon Crawford, who made his major league debut in May 2011, and continues to play for the Giants to this day. Stats are reflective as of the end of the 2021 regular season.
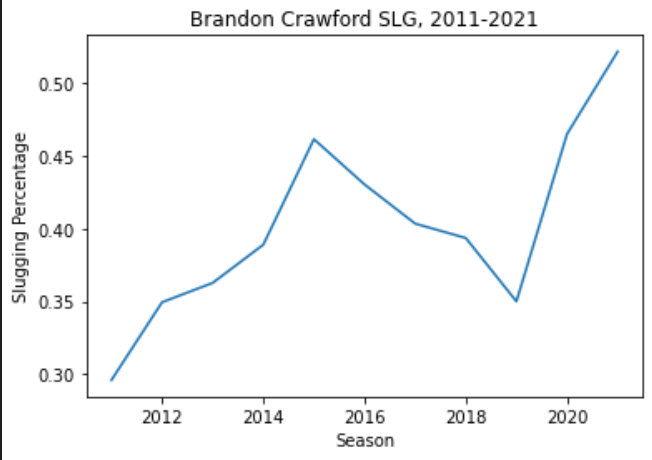
A batter’s slugging percentage can say a lot about how well a player hits the ball and runs around the bases. The more extra base hits and home runs that player hits, the higher their slugging percentage is, and the more likely they are to gather runs batted in (RBIs) per game and the more likely they themselves are to get home and score a run. These factors will determine one’s win shares and can better reflect the decision-making that coaches need to consider for their starting lineups and where they are placed in the batting order.
This was one of the many examples of visualizations done on baseball players’ data, whether it was for pitching or for batting, to determine their strength in how they perform and any changes that they made over the course of their career that showed either their decline or improvement.
Another branch of the project involved usage of predicting batters’ outcomes when it comes to the pitch they receive. Whether or not the batter hit the ball or not is not fully considered during the at-bat, as this simulator implemented in a Jupyter notebook running Python used the Pandas and NumPy libraries to utilize functions to randomize the kinds of pitches that batters would be faced with when at bat.
The probability of certain pitches thrown and at what frequency by the “pitcher” can be adjusted accordingly to whichever pitcher it is attributed to, and what pitches they actually throw are also randomized based on the kinds they select. The following results from the simulator were generated into a Pandas DataFrame, consisting of four columns: the count, the pitch type, whether or not the batter swung, and if swung, whether or not that ball in play resulted in a hit or not.
There were many different scenarios that came about because of the many different combinations and possibilities that could be randomly inputted or generated, that would produce potentially exponentially unique outcomes across the four factors. No specific pitcher or hitter was used in this simulation, but it provided a general overview of the predictability, or lack thereof, of the kinds of pitches that a batter may encounter in an at-bat depending on the count or the type of pitch, and if they are more or less likely to take a swing at that pitch or not take a swing at something that they are not able to hit. This is independent of the data that was provided as seen in earlier data visualizations with certain individuals or overall in MLB. In contrast, this simulation not only provides situations at if/when batters can take a swing at a pitch, but it also provides many different opportunities to how one’s pitching repertoire can be adjusted or improved to get batters out, to bait them into taking certain pitches that are not hittable, or to strike them out and not even put the ball in play.
Baseball is a sport in which numbers have been more useful than before to find where players can improve, where things have been down for them, and what changes need to be made to accommodate to new changes in the game, new players, and new managing styles. Coaches, managers, front office executives, and other baseball experts have been and will continue to utilize Sabermetrics and other means of advanced statistical analysis to trade, draft, or sign certain players that have a proven record of performing at a high level of pitching and/or hitting based on numbers, and have the skills necessary to be ready for The Show whenever their time comes.
There may be more to come out of this project, including more visualizations, machine learning of this data, and updated statistics and newer means of analysis that can show more beyond the numbers. If that is the case, the repository is linked here, which can be used to check for more updates on this project, if any arise in the near future.
